はじめに
『パターン認識と機械学習』の独学時のまとめです。一連の記事は「数式の行間埋め」または「R・Pythonでのスクラッチ実装」からアルゴリズムの理解を補助することを目的としています。本とあわせて読んでください。
この記事は、2.3.1項と2.3.2項の内容です。同時ガウス分布から条件付きガウス分布と周辺ガウス分布のパラメータを求めてPythonでグラフを作成します。
【数式読解編】
【他の節一覧】
【この節の内容】
2.3.1-2 条件付きガウス分布と周辺ガウス分布の可視化
2次元ガウス分布(2変数の同時分布)から条件付きガウス分布と周辺ガウス分布のパラメータを計算してグラフを作成します。
利用するライブラリを読み込みます。
# 2.3.1-2項で利用するライブラリ
import numpy as np
from scipy.stats import norm, multivariate_normal # 1変量ガウス分布, 多変量ガウス分布
import matplotlib.pyplot as plt
from matplotlib.animation import FuncAnimation
条件付き分布の変化をアニメーションで確認するのにMatplotlibライブラリのanimationモジュールを利用します。不要であれば省略してください。
・同時ガウス分布の設定
まずは、元となる同時ガウス分布のパラメータを設定します。ここでは、3次元のグラフで可視化するため$D = 2$であり$M = 1$です。
# インデックスを設定:(固定)
a = 0
b = 1

# 平均パラメータを指定
mu_d = np.array([0.0, 0.0])

# 分散共分散行列を指定
sigma_dd = np.array([[20.0, -10.0], [-10.0, 7.0]])

# 精度行列を計算
lambda_dd = np.linalg.inv(sigma_dd)
(添字が0なのか1なのかややこしいので、)添字として利用する変数a, bを作成しておきます。
平均$\boldsymbol{\mu}$と分散共分散行列$\boldsymbol{\Sigma}$を指定して、精度行列$\boldsymbol{\Lambda}$を計算します。
逆行列は、np.linalg.inv()で計算できます。
作図用の$\mathbf{x}$の点を作成します。
# 作図用のxのx軸の値を作成
x_a = np.linspace(
    mu_d[a] - 3 * np.sqrt(sigma_dd[a, a]),
    mu_d[a] + 3 * np.sqrt(sigma_dd[a, a]),
    num=500
)

# 作図用のxのy軸の値を作成
x_b = np.linspace(
    mu_d[b] - 3 * np.sqrt(sigma_dd[b, b]),
    mu_d[b] + 3 * np.sqrt(sigma_dd[b, b]),
    num=500
)

# 作図用のxの点を作成
X_a, X_b = np.meshgrid(x_a, x_b)
x_point = np.stack([X_a.flatten(), X_b.flatten()], axis=1)
x_dims = X_a.shape

# 確認
print(x_point)
print(x_point.shape)
print(x_dims)
[[-13.41640786  -7.93725393]
 [-13.36263469  -7.93725393]
 [-13.30886151  -7.93725393]
 ...
 [ 13.30886151   7.93725393]
 [ 13.36263469   7.93725393]
 [ 13.41640786   7.93725393]]
(250000, 2)
(500, 500)
グラフとして描画するx軸の値をnp.linspace()で作成してx_aとします。この例では、x軸($x_a$軸)方向の平均mu_d[a]を中心に標準偏差np.sqrt(sigma_dd[a, a])の3倍を範囲とします。処理が重い場合は、この値を調整してください。
y軸の値x_bも同様にして作成します。
平方根は、np.sqrt()で計算できます。
x_a, x_bとして作成した値に対して、全ての組み合わせを持つように$\mathbf{x} = (x_a, x_b)$の値をnp.meshgrid()で作成します。X_a, X_bの各要素が、1つの点$\mathbf{x}$に対応します。
同時ガウス分布(多変量ガウス分布)を計算します。
# 同時ガウス分布を計算
joint_dens = multivariate_normal.pdf(
    x=x_point, mean=mu_d, cov=sigma_dd
)

# 確認
print(joint_dens[:5])
print(joint_dens.shape)
[1.44068932e-27 1.81815823e-27 2.29336539e-27 2.89131274e-27
 3.64331836e-27]
(250000,)
多変量ガウス分布の確率密度は、scipyのmultivariate_normal.pdf()で計算できます。平均の引数meanにmu_d、分散共分散行列の引数covにsigma_ddを指定します。
同時ガウス分布の等高線グラフと3Dグラフを作成します。
# 同時ガウス分布の2Dグラフを作成
plt.figure(figsize=(9, 8))
plt.contour(X_a, X_b, joint_dens.reshape(x_dims), cmap='jet') # 同時分布:(等高線図)
plt.xlabel('$x_a$')
plt.ylabel('$x_b$')
plt.suptitle('Joint Gaussian Distribution', fontsize=20)
plt.title('$\mu=(' + ', '.join([str(mu) for mu in mu_d]) + ')' +
          ', \Sigma=' + str([list(sgm_d) for sgm_d in np.round(sigma_dd, 1)]) + '$', loc='left')
plt.grid()
plt.colorbar(label='density')
plt.gca().set_aspect('equal')
plt.show()
# 同時ガウス分布の3Dグラフを作成
fig = plt.figure(figsize=(8, 8))
ax = fig.add_subplot(projection='3d') # 3D用の設定
ax.plot_surface(X_a, X_b, joint_dens.reshape(x_dims), cmap='jet') # 同時分布:(曲面図)
#ax.contour(X_a, X_b, joint_dens.reshape(x_dims), cmap='jet', offset=0) # 同時分布:(等高線図)
ax.set_xlabel('$x_a$')
ax.set_ylabel('$x_b$')
ax.set_zlabel('density')
plt.title('$\mu=(' + ', '.join([str(mu) for mu in mu_d]) + ')' +
          ', \Sigma=' + str([list(sgm_d) for sgm_d in np.round(sigma_dd, 1)]) + '$',
          loc='left')
fig.suptitle('Joint Gaussian Distribution', fontsize=20)
#ax.view_init(elev=0, azim=300) # 表示アングル
plt.show()


この2変量ガウス分布(2変数の同時分布)を用いて、1つの変数が得られたときの分布(条件付き分布)と、1つの変数を周辺化した分布(周辺分布)を求めます。
・条件付きガウス分布の計算
次に、条件付きガウス分布を可視化します。
観測値$\mathbf{x}$を指定して、条件付きガウス分布のパラメータを計算します。
# xの点を指定
x_d = np.array([-7.0, 3.0])

# x1の条件付きガウス分布のパラメータを計算
mu_a = mu_d[a] + sigma_dd[a, b] / sigma_dd[b, b] * (x_d[b] - mu_d[b])
sigma_a = sigma_dd[a, a] - sigma_dd[a, b] / sigma_dd[b, b] * sigma_dd[b, a]
print(mu_a)
print(sigma_a)
mu_a = mu_d[a] - (1.0 / lambda_dd[a, a]) * lambda_dd[a, b] * (x_d[b] - mu_d[b])
sigma_a = 1.0 / lambda_dd[a, a]
print(mu_a)
print(sigma_a)

# x2の条件付きガウス分布のパラメータを計算
mu_b = mu_d[b] + sigma_dd[b, a] / sigma_dd[a, a] * (x_d[a] - mu_d[a])
sigma_b = sigma_dd[b, b] - sigma_dd[b, a] / sigma_dd[a, a] * sigma_dd[a, b]
print(mu_b)
print(sigma_b)
mu_b = mu_d[b] - (1.0 / lambda_dd[b, b]) * lambda_dd[b, a] * (x_d[a] - mu_d[a])
sigma_b = 1.0 / lambda_dd[b, b]
print(mu_b)
print(sigma_b)
-4.285714285714286
5.7142857142857135
-4.285714285714286
5.714285714285714
3.5
2.0
3.5
2.0
観測値として$\mathbf{x} = (\mathbf{x}_a, \mathbf{x}_b) = (x_1, x_2)$を指定します。
$\mathbf{x}_a$の条件付き分布は、平均$\boldsymbol{\mu}_{a|b}$・分散共分散行列$\boldsymbol{\Sigma}_{a|b}$の$M$次元ガウス分布です。
平均・分散共分散行列パラメータは、次の式で計算します。
ただし、ここでは$M = 1$なので、分散共分散行列$\boldsymbol{\Sigma}_{b,b}$は分散(スカラ)$\sigma_{b,b}^2$です。よって、逆行列$\boldsymbol{\Sigma}_{b,b}^{-1}$は逆数$(\sigma_{b,b}^2)^{-1} = \frac{1}{\sigma_{b,b}^2}$で計算します。
条件付きガウス分布を計算します。
# 条件付きガウス分布を計算
conditional_dens_a = norm.pdf(x=x_a, loc=mu_a, scale=np.sqrt(sigma_a))
conditional_dens_b = norm.pdf(x=x_b, loc=mu_b, scale=np.sqrt(sigma_b))

# 確認
print(conditional_dens_a[:5])
print(conditional_dens_a.shape)
[0.00011332 0.00012346 0.00013444 0.00014631 0.00015916]
(500,)
1変量ガウス分布の確率密度は、scipyのnorm.pdf()で計算できます。平均の引数locにmu_a, mu_b、標準偏差の引数scaleに平方根をとったsigma_a, sigma_bを指定します。
条件付きガウス分布を作図します。
# 条件付きガウス分布の3Dグラフを作成
fig = plt.figure(figsize=(8, 8))
ax = fig.add_subplot(projection='3d') # 3D用の設定
ax.plot_surface(X_a, X_b, joint_dens.reshape(x_dims), cmap='jet', alpha=0.5) # 同時分布:(曲面図)
ax.contour(X_a, X_b, joint_dens.reshape(x_dims), cmap='jet', linestyles='--', offset=0) # 同時分布:(等高線図)
ax.plot(x_a, np.repeat(x_d[b], len(x_a)), conditional_dens_a, color='darkturquoise', label='$p(x_a | x_b)$') # x1の条件付き分布
ax.plot(x_a, np.repeat(x_d[b], len(x_a)), np.repeat(0, len(x_a)), color='darkturquoise', linestyle=':') # x1の条件付き分布の補助線
ax.plot(np.repeat(x_d[a], len(x_b)), x_b, conditional_dens_b, color='blue', label='$p(x_b | x_a)$') # x2の条件付き分布
ax.plot(np.repeat(x_d[a], len(x_b)), x_b, np.repeat(0, len(x_b)), color='blue', linestyle=':') # x2の条件付き分布の補助線
ax.scatter(x_d[a], x_d[b], color='orange', marker='+', s=200, label='$(x_a, x_b)$') # xの点
ax.set_xlabel('$x_a$')
ax.set_ylabel('$x_b$')
ax.set_zlabel('density')
ax.set_title('$x=(' + ', '.join([str(x) for x in np.round(x_d, 1)]) + ')' +
             ', \mu_{a|b}=' + str(np.round(mu_a, 1)) + ', \Sigma_{a|b}=' + str(np.round(sigma_a, 1)) +
             ', \mu_{b|a}=' + str(np.round(mu_b, 1)) + ', \Sigma_{b|a}=' + str(np.round(sigma_b, 1)) + '$', loc='left')
fig.suptitle('Conditional Gaussian Distribution', fontsize=20)
ax.legend()
#ax.view_init(elev=0, azim=300) # 表示アングル
plt.show()

青緑色の実線(曲線)が$x_a$の条件付き分布、青色の実線(曲線)が$x_b$の条件付き分布です。点線(直線)は軸を表す補助線です。
塗りつぶしと破線(楕円)が$x_a, x_b$の同時分布です。
同時分布は2つの変数$x_a, x_b$を積分すると1になるように正規化されているのに対して、$x_a$の条件分布は$x_a$を積分すると1になるように正規化されているので、条件分布(1つの変数の分布)の方が確率密度(z軸の値)が高くなっています。
観測値の変化に対する条件付きガウス分布の変化をアニメーションで確認します。
・作図コード(クリックで展開)
# フレーム数を指定
n_frame = 100

# 使用するpの値を作成
x_a_vals = np.linspace(np.min(x_a), np.max(x_a), num=n_frame) # x軸の値
x_b_vals = np.linspace(np.min(x_b), np.max(x_b), num=n_frame) # y軸の値

# 図を初期化
fig = plt.figure(figsize=(8, 8))
ax = fig.add_subplot(projection='3d') # 3D用の設定
fig.suptitle('Conditional Gaussian Distribution', fontsize=20)

# 作図処理を関数として定義
def update(i):
    # 前フレームのグラフを初期化
    plt.cla()

    # i回目のxの値を取得
    x_d[a] = x_a_vals[i]
    x_d[b] = x_b_vals[i]

    # x1の条件付きガウス分布のパラメータを計算
    mu_a = mu_d[a] + sigma_dd[a, b] / sigma_dd[b, b] * (x_d[b] - mu_d[b])
    sigma_a = sigma_dd[a, a] - sigma_dd[a, b] / sigma_dd[b, b] * sigma_dd[b, a]

    # x2の条件付きガウス分布のパラメータを計算
    mu_b = mu_d[b] + sigma_dd[b, a] / sigma_dd[a, a] * (x_d[a] - mu_d[a])
    sigma_b = sigma_dd[b, b] - sigma_dd[b, a] / sigma_dd[a, a] * sigma_dd[a, b]

    # 条件付きガウス分布を計算
    conditional_dens_a = norm.pdf(x=x_a, loc=mu_a, scale=np.sqrt(sigma_a))
    conditional_dens_b = norm.pdf(x=x_b, loc=mu_b, scale=np.sqrt(sigma_b))

    # 条件付きガウス分布の3Dグラフを作成
    #ax.plot_surface(X_a, X_b, multivariate_dens.reshape(x_dims), cmap='jet', alpha=0.5) # 同時分布:(曲面図)
    ax.contour(X_a, X_b, joint_dens.reshape(x_dims), cmap='jet', linestyles='--', offset=0) # 同時分布:(等高線図)
    ax.plot(x_a, np.repeat(x_d[b], len(x_a)), conditional_dens_a, color='darkturquoise', label='$p(x_a | x_b)$') # x1の条件付き分布
    ax.plot(x_a, np.repeat(x_d[b], len(x_a)), np.repeat(0, len(x_a)), color='darkturquoise', linestyle=':') # x1の条件付き分布の補助線
    ax.plot(np.repeat(x_d[a], len(x_b)), x_b, conditional_dens_b, color='blue', label='$p(x_b | x_a)$') # x2の条件付き分布
    ax.plot(np.repeat(x_d[a], len(x_b)), x_b, np.repeat(0, len(x_b)), color='blue', linestyle=':') # x2の条件付き分布の補助線
    ax.scatter(x_d[a], x_d[b], color='orange', marker='+', s=200, label='$(x_a, x_b)$') # xの点
    ax.set_xlabel('$x_a$')
    ax.set_ylabel('$x_b$')
    ax.set_zlabel('density')
    ax.set_title('$x=(' + ', '.join([str(x) for x in np.round(x_d, 1)]) + ')' +
                 ', \mu_{a|b}=' + str(np.round(mu_a, 1)) + ', \Sigma_{a|b}=' + str(np.round(sigma_a, 1)) +
                 ', \mu_{b|a}=' + str(np.round(mu_b, 1)) + ', \Sigma_{b|a}=' + str(np.round(sigma_b, 1)) + '$', loc='left')
    ax.legend()
    #ax.view_init(elev=0, azim=300) # 表示アングル

# gif画像を作成
anime_conditional = FuncAnimation(fig, update, frames=n_frame, interval=100)

# gif画像を保存
anime_conditional.save('ch2_3_1_ConditionalDistribution_1.gif')


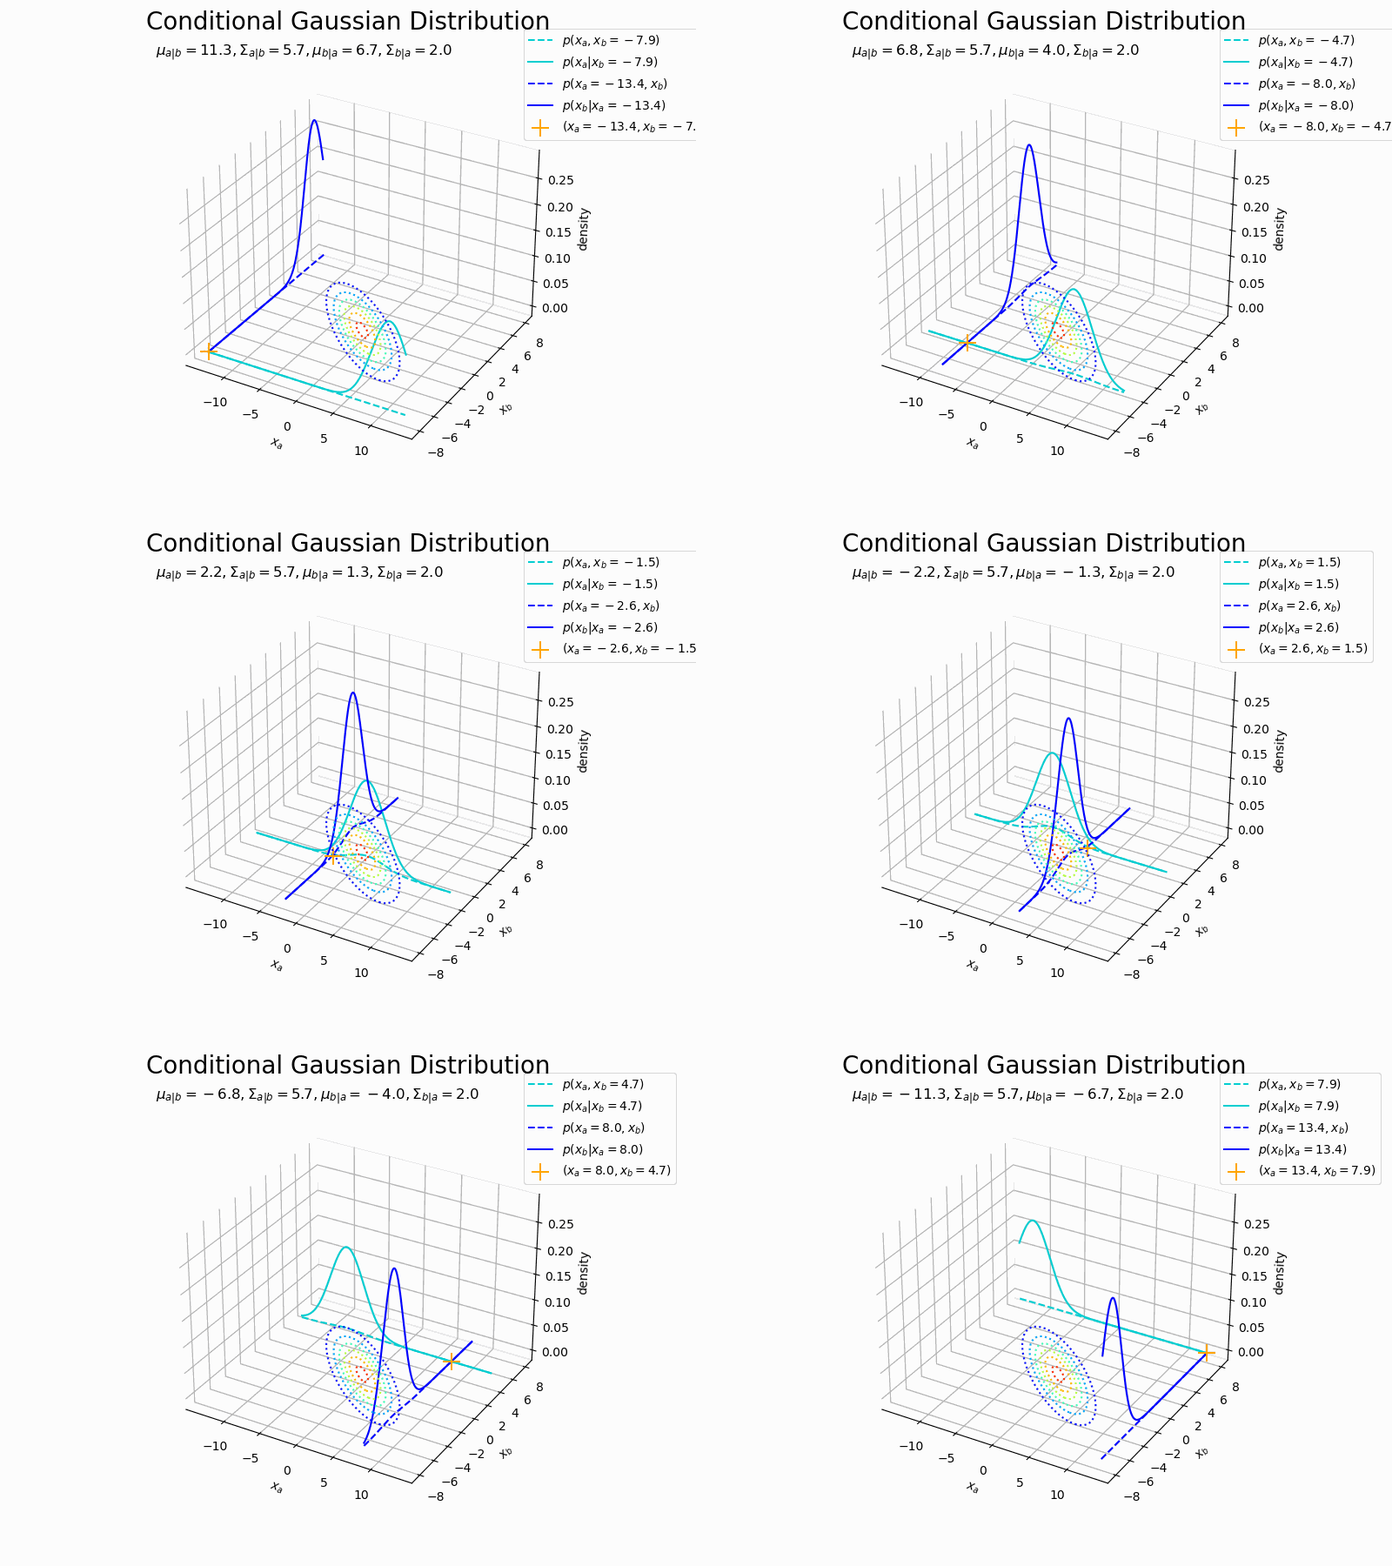
式から分かるように、平均$\boldsymbol{\mu}_{a|b}, \boldsymbol{\mu}_{b|a}$は観測値$\mathbf{x}$の影響を受けるので、分布の中心が移動します。
分散共分散行列$\boldsymbol{\Sigma}_{a|b}, \boldsymbol{\Sigma}_{b|a}$は影響を受けないので、分布の形状が変化しません。
同時分布と条件分布の関係を見ました。
続いて、一方の変数を固定した同時分布と条件分布の関係を見ます。
# xの点を指定
x_d = np.array([-7.0, 3.0])

# 1つの変数を固定した同時ガウス分布の確率密度を計算
joint_dens_a = multivariate_normal.pdf(
    x=np.stack([x_a, np.repeat(x_d[b], len(x_a))], axis=1), mean=mu_d, cov=sigma_dd
)
joint_dens_b = multivariate_normal.pdf(
    x=np.stack([np.repeat(x_d[a], len(x_b)), x_b], axis=1), mean=mu_d, cov=sigma_dd
)

# 確認
print(joint_dens_a[:5])
print(joint_dens_a.shape)
[8.98448915e-06 9.78811871e-06 1.06582353e-05 1.15998298e-05
 1.26182222e-05]
(500,)
作図用の点x_pointと同様に、x軸の値x_aと観測値のy軸の値x_d[b]の2列の配列を作成して、同時分布を計算します。
変数を固定した同時ガウス分布と条件分布を作図します。
# 条件付きガウス分布の3Dグラフを作成
fig = plt.figure(figsize=(10, 8))
ax = fig.add_subplot(projection='3d') # 3D用の設定
ax.contour(X_a, X_b, joint_dens.reshape(x_dims), cmap='jet', linestyles=':', offset=0) # 同時分布:(等高線図)
ax.plot(x_a, np.repeat(x_d[b], len(x_a)), joint_dens_a, color='darkturquoise', linestyle='--', label='$p(x_a, x_b=' + str(x_d[b]) + ')$') # x2を固定した同時分布
ax.plot(x_a, np.repeat(x_d[b], len(x_a)), conditional_dens_a, color='darkturquoise', label='$p(x_a | x_b=' + str(x_d[b]) + ')$') # x1の条件付き分布
ax.plot(np.repeat(x_d[a], len(x_b)), x_b, joint_dens_b, color='blue', linestyle='--', label='$p(x_a=' + str(x_d[a]) + ', x_b)$') # x1を固定した同時分布
ax.plot(np.repeat(x_d[a], len(x_b)), x_b, conditional_dens_b, color='blue', label='$p(x_b | x_a=' + str(x_d[a]) + ')$') # x2の条件付き分布
ax.scatter(x_d[a], x_d[b], color='orange', marker='+', s=200, label='$(x_a=' + str(x_d[a]) + ', x_b=' + str(x_d[b]) + ')$') # xの点
ax.set_xlabel('$x_a$')
ax.set_ylabel('$x_b$')
ax.set_zlabel('density')
ax.set_title('$\mu_{a|b}=' + str(np.round(mu_a, 1)) + ', \Sigma_{a|b}=' + str(np.round(sigma_a, 1)) +
             ', \mu_{b|a}=' + str(np.round(mu_b, 1)) + ', \Sigma_{b|a}=' + str(np.round(sigma_b, 1)) + '$', loc='left')
fig.suptitle('Conditional Gaussian Distribution', fontsize=20)
ax.legend(bbox_to_anchor=(0.9, 1.1), loc='upper left')
#ax.view_init(elev=0, azim=270) # 表示アングル
plt.show()


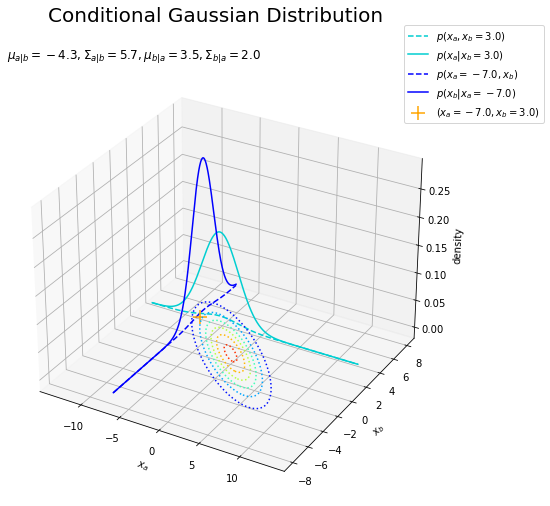
先ほどと同様に、青緑色の実線が$x_a$の条件付き分布、青色の実線が$x_b$の条件付き分布です。
青緑色の破線は$x_b = 3$で切り取った$x_a, x_b$の同時分布を断面図です。青色の破線は$x_a = -7$での断面図です。
それぞれ破線を正規化したのが実線になります(だよね?)。
こちらもアニメーションで確認します。
・作図コード(クリックで展開)
# 図を初期化
fig = plt.figure(figsize=(10, 8))
ax = fig.add_subplot(projection='3d') # 3D用の設定
fig.suptitle('Conditional Gaussian Distribution', fontsize=20)

# 作図処理を関数として定義
def update(i):
    # 前フレームのグラフを初期化
    plt.cla()

    # i回目のxの値を取得
    x_d[a] = x_a_vals[i]
    x_d[b] = x_b_vals[i]

    # x1の条件付きガウス分布のパラメータを計算
    mu_a = mu_d[a] + sigma_dd[a, b] / sigma_dd[b, b] * (x_d[b] - mu_d[b])
    sigma_a = sigma_dd[a, a] - sigma_dd[a, b] / sigma_dd[b, b] * sigma_dd[b, a]

    # x2の条件付きガウス分布のパラメータを計算
    mu_b = mu_d[b] + sigma_dd[b, a] / sigma_dd[a, a] * (x_d[a] - mu_d[a])
    sigma_b = sigma_dd[b, b] - sigma_dd[b, a] / sigma_dd[a, a] * sigma_dd[a, b]

    # 条件付きガウス分布を計算
    conditional_dens_a = norm.pdf(x=x_a, loc=mu_a, scale=np.sqrt(sigma_a))
    conditional_dens_b = norm.pdf(x=x_b, loc=mu_b, scale=np.sqrt(sigma_b))

    # 1つの変数を固定した同時ガウス分布の確率密度を計算
    joint_dens_a = multivariate_normal.pdf(
        x=np.stack([x_a, np.repeat(x_d[b], len(x_a))], axis=1), mean=mu_d, cov=sigma_dd
    )
    joint_dens_b = multivariate_normal.pdf(
        x=np.stack([np.repeat(x_d[a], len(x_b)), x_b], axis=1), mean=mu_d, cov=sigma_dd
    )

    # 条件付きガウス分布の3Dグラフを作成
    ax.contour(X_a, X_b, joint_dens.reshape(x_dims), cmap='jet', linestyles=':', offset=0) # 同時分布:(等高線図)
    ax.plot(x_a, np.repeat(x_d[b], len(x_a)), joint_dens_a, color='darkturquoise', linestyle='--', label='$p(x_a, x_b=' + str(np.round(x_d[b], 1)) + ')$') # x2を固定した同時分布
    ax.plot(x_a, np.repeat(x_d[b], len(x_a)), conditional_dens_a, color='darkturquoise', label='$p(x_a | x_b=' + str(np.round(x_d[b], 1)) + ')$') # x1の条件付き分布
    ax.plot(np.repeat(x_d[a], len(x_b)), x_b, joint_dens_b, color='blue', linestyle='--', label='$p(x_a=' + str(np.round(x_d[a], 1)) + ', x_b)$') # x1を固定した同時分布
    ax.plot(np.repeat(x_d[a], len(x_b)), x_b, conditional_dens_b, color='blue', label='$p(x_b | x_a=' + str(np.round(x_d[a], 1)) + ')$') # x2の条件付き分布
    ax.scatter(x_d[a], x_d[b], color='orange', marker='+', s=200, label='$(x_a=' + str(np.round(x_d[a], 1)) + ', x_b=' + str(np.round(x_d[b], 1)) + ')$') # xの点
    ax.set_xlabel('$x_a$')
    ax.set_ylabel('$x_b$')
    ax.set_zlabel('density')
    ax.set_title('$\mu_{a|b}=' + str(np.round(mu_a, 1)) + ', \Sigma_{a|b}=' + str(np.round(sigma_a, 1)) +
                 ', \mu_{b|a}=' + str(np.round(mu_b, 1)) + ', \Sigma_{b|a}=' + str(np.round(sigma_b, 1)) + '$', loc='left')
    ax.legend(bbox_to_anchor=(0.9, 1.1), loc='upper left')
    #ax.view_init(elev=0, azim=270) # 表示アングル

# gif画像を作成
anime_conditional = FuncAnimation(fig, update, frames=n_frame, interval=100)

# gif画像を保存
anime_conditional.save('ch2_3_1_ConditionalDistribution_2.gif')


同時分布の断面図の形状が変化しているのが分かります(いい感じに連動すると思ってアニメにしたけどあんまり面白くなくて残念)。
・周辺ガウス分布の計算
最後に、周辺ガウス分布を可視化します。
周辺分布のパラメータは手元にあるので、周辺ガウス分布を計算します。
# 周辺ガウス分布を計算
marginal_dens_a = norm.pdf(x=x_a, loc=mu_d[a], scale=np.sqrt(sigma_dd[a, a]))
marginal_dens_b = norm.pdf(x=x_b, loc=mu_d[b], scale=np.sqrt(sigma_dd[b, b]))

# 確認
print(marginal_dens_a[:5])
print(marginal_dens_a.shape)
[0.00099099 0.00102732 0.00106482 0.00110353 0.00114349]
(500,)
$\mathbf{x}_a$の周辺分布は、平均$\boldsymbol{\mu}_a$・分散共分散行列$\boldsymbol{\Sigma}_{a,a}$の$M$次元ガウス分布です。
分散共分散行列は、次の式でも計算できます。
# 確認
print(sigma_dd[a, a])
print(1.0 / (lambda_dd[a, a] - lambda_dd[a, b] / lambda_dd[b, b] * lambda_dd[b, a]))
print(sigma_dd[b, b])
print(1.0 / (lambda_dd[b, b] - lambda_dd[b, a] / lambda_dd[a, a] * lambda_dd[a, b]))
20.0
20.000000000000004
7.0
7.0
プログラム上の誤差が生じています。
周辺ガウス分布を作図します。
# 周辺ガウス分布の3Dグラフを作成
fig = plt.figure(figsize=(8, 8))
ax = fig.add_subplot(projection='3d') # 3D用の設定
ax.plot_surface(X_a, X_b, joint_dens.reshape(x_dims), cmap='jet', alpha=0.5) # 同時分布:(曲面図)
#ax.contour(X_a, X_b, joint_dens.reshape(x_dims), cmap='jet', linestyles='--', offset=0) # 同時分布:(等高線図)
ax.plot(x_a, np.repeat(np.max(x_b), len(x_a)), marginal_dens_a, color='darkturquoise', label='$p(x_a)$') # x1の周辺分布
ax.plot(x_a, np.repeat(np.max(x_b), len(x_a)), np.repeat(0, len(x_a)), color='darkturquoise', linestyle=':') # x1の周辺分布の補助線
ax.plot(np.repeat(np.max(x_a), len(x_b)), x_b, marginal_dens_b, color='blue', label='$p(x_b)$') # x2の周辺分布
ax.plot(np.repeat(np.max(x_a), len(x_b)), x_b, np.repeat(0, len(x_b)), color='blue', linestyle=':') # x2の周辺分布の補助線
ax.set_xlabel('$x_a$')
ax.set_ylabel('$x_b$')
ax.set_zlabel('density')
ax.set_title('$\mu_a=' + str(np.round(mu_d[a], 1)) + ', \Sigma_{a,a}=' + str(np.round(sigma_dd[a, a], 1)) +
             ', \mu_b=' + str(np.round(mu_d[b], 1)) + ', \Sigma_{b,b}=' + str(np.round(sigma_dd[b, b], 1)) + '$', loc='left')
fig.suptitle('Marginal Gaussian Distribution', fontsize=20)
ax.legend()
#ax.view_init(elev=0, azim=270) # 表示アングル
plt.show()


青緑色の実線(曲線)が$x_a$の周辺分布、青色の実線(曲線)が$x_a$の周辺分布です。
一方の変数を周辺化(積分消去)するので、観測値の影響を受けません。(そのため、グラフの位置はどこでもいいのですがこの例では最大値に配置しています。)
$x_a$の周辺分布であれば$x_b$軸(y軸)方向に足し合わせたような形になります。この例では単峰の分布なので、真横から見た形と同様の形になります。
参考文献
- C.M.ビショップ著,元田 浩・他訳『パターン認識と機械学習 上下』,丸善出版,2012年.
おわりに
思ったほど面白くなかった。条件付き分布の形状がもっと変わると思ってた勘違いを訂正できた。