はじめに
gganimateパッケージについて理解したいシリーズです。
この記事では、バーチャートレースとラインチャートレースをR言語で作成します。
【他の内容】
【目次】
バーチャートレース
gganimateパッケージを利用して、バーチャートレース(Bar chart race)とラインチャートレース(Line chart race)のアニメーション(gif画像)を作成します。
利用するパッケージを読み込みます。
# 利用パッケージ
library(gganimate)
library(tidyverse)
データの準備
利用するデータを用意します。この例では、繰り返しサイコロを振ったときの出目の推移を可視化します。
まずは、プログラム上でサイコロを振ります。
# 試行回数を指定
N <- 50

# 面の数を指定
V <- 6

# サイコロを振る
result_mat <- rmultinom(n = N, size = 1, prob = rep(1/V, times = V))
result_mat[, 1:10]
##      [,1] [,2] [,3] [,4] [,5] [,6] [,7] [,8] [,9] [,10]
## [1,]    0    0    0    0    0    0    0    1    0     0
## [2,]    0    1    1    1    1    1    0    0    0     0
## [3,]    0    0    0    0    0    0    0    0    1     0
## [4,]    0    0    0    0    0    0    0    0    0     1
## [5,]    0    0    0    0    0    0    1    0    0     0
## [6,]    1    0    0    0    0    0    0    0    0     0
サイコロを振った結果は、多項分布の乱数生成関数rmultinom()で再現できます。
試行回数の引数nにN、1試行当たりのサイコロの数の引数sizeに1、サイコロの各面の出現確率の引数probに1/Vを複製して指定します。
行がサイコロの面、列が試行に対応しており、値が1の行番号が出た面を表します。
面ごとに出現回数をカウントして、出現回数に応じてランキングを付けます。
# 出現回数で順位付け
rank_df <- tibble::tibble(
  iteration = rep(0:N, each = V),
  v = rep(1:V, times = N+1) %>%
    factor(),
  result = c(rep(0, times = V), as.vector(result_mat))
) %>% # 0回目の結果を追加
  dplyr::group_by(v) %>% # 面でグループ化
  dplyr::mutate(count = cumsum(result)) %>% # 試行ごとに集計
  dplyr::group_by(iteration) %>% # 試行回数でグループ化
  dplyr::mutate(ranking = dplyr::row_number(-count)) %>% # 出現回数で順位付け
  dplyr::ungroup() # グループ化の解除
アニメーションの演出として、試行前(0回目の結果)に相当する行を追加しておきます。
試行回数の列iterationとして、0からNの整数をV個ずつ複製します。サイコロの面の列vとして、1からVの整数をN+1回繰り返して、作図時の色分けなどのために因子型に変換します。サイコロの結果の列resultとして、V個の0の後にベクトルに変換したサイコロの結果を繋げます。
サイコロの面でグループ化して、cumsum()で累積和を計算します。面ごとに、1行目(0回目)からn行目(n-1回目)までの値の合計がn行目の値になります。つまり、試行ごとにその試行までの出現回数が求まります。
試行回数でグループ化して、試行ごとにrow_number()で出現回数の順位を付けます。指定した列の値が小さい順に通し番号が割り振られるので、列名に-を付けて大小関係を入れ換えます。
作成したデータフレームは次のようになります。
# 確認
head(rank_df, 15)
## # A tibble: 15 x 5
##    iteration v     result count ranking
##        <int> <fct>  <dbl> <dbl>   <int>
##  1         0 1          0     0       1
##  2         0 2          0     0       2
##  3         0 3          0     0       3
##  4         0 4          0     0       4
##  5         0 5          0     0       5
##  6         0 6          0     0       6
##  7         1 1          0     0       2
##  8         1 2          0     0       3
##  9         1 3          0     0       4
## 10         1 4          0     0       5
## 11         1 5          0     0       6
## 12         1 6          1     1       1
## 13         2 1          0     0       3
## 14         2 2          1     1       1
## 15         2 3          0     0       4
iteration列はフレーム番号を表し、値が小さい順に、同じ値の行(データ)を使ってグラフが描画されます。
v列はカテゴリ名を表すので、値である必要はありません。この列が示す重複しないV個(行)のデータが1セット(1フレームで描画するデータ)です。
result列は作図に利用しません。
count列はバーのy軸の値・バーの高さ、ranking列はx軸の値・バーの位置に対応します。
アニメーションの作成
2種類のバーチャートレースと2種類のラインチャートレースを作成します。
1つ目は、出現回数の最大値でy軸の表示範囲を固定するアニメーションです。
# 遷移フレーム数を指定
t <- 8

# 実データでの停止フレーム数を指定
s <- 4

# 最終結果での停止フレーム数を指定
e <- 50

# バーチャートレースを作成:(y軸固定)
anim <- ggplot(rank_df, aes(x = ranking, y = count, fill = v, color = v)) +
  geom_bar(stat = "identity", width = 0.9, alpha = 0.8) + # 出現回数のバー
  geom_text(aes(y = 0, label = paste(v, " ")), hjust = 1) + # カテゴリ名
  geom_text(aes(y = 0, label = paste(" ", round(count))), hjust = 0, color = "white") + # 出現回数
  gganimate::transition_states(states = iteration, transition_length = t, state_length = s, wrap = FALSE) + # フレーム
  gganimate::ease_aes("cubic-in-out") + # アニメーションの緩急
  scale_fill_manual(values = c("pink", "limegreen", "red", "orange", "mediumblue", "yellow")) + # バーの色:(不必要)
  scale_color_manual(values = c("pink", "limegreen", "red", "orange", "mediumblue", "yellow")) + # 枠線の色:(不必要)
  theme(
    axis.title.y = element_blank(), # 縦軸のラベル
    axis.text.y = element_blank(), # 縦軸の目盛ラベル
    #panel.grid.major.x = element_line(color = "grey", size = 0.1), # 横軸の主目盛線
    panel.grid.major.y = element_blank(), # 縦軸の主目盛線
    panel.grid.minor.x = element_blank(), # 横軸の補助目盛線
    panel.grid.minor.y = element_blank(), # 縦軸の補助目盛線
    panel.border = element_blank(), # グラフ領域の枠線
    #panel.background = element_blank(), # グラフ領域の背景
    plot.title = element_text(color = "black", face = "bold", size = 20, hjust = 0.5), # 全体のタイトル
    plot.subtitle = element_text(color = "black", size = 15, hjust = 0.5), # 全体のサブタイトル
    plot.margin = margin(t = 10, r = 10, b = 10, l = 40, unit = "pt"), # 全体の余白
    legend.position = "none" # 凡例の表示位置
  ) + # 図の体裁
  coord_flip(clip = "off", expand = FALSE) + # 軸の入れ替え
  scale_x_reverse(breaks = 1:V) + # x軸を反転
  labs(title = "Bar Chart Race",
       subtitle = "iteration = {closest_state}") # ラベル

# gif画像を作成
gganimate::animate(
  plot = anim,
  nframes = (N+1)*(t+s)+e, end_pause = e, fps = (t+s)*3,
  width = 600, height = 450
)
x軸の値(バーの表示位置)にranking列(出現回数の順位)、y軸の値(バーの高さ)にcount列(出現回数)、バーなどの色にv列(サイコロの面)を指定します。
ただし、coord_flip()でx軸とy軸を入れ替えるので、x軸が縦軸でy軸が横軸になります。また、scale_x_reverse()でx軸を昇順に並べ替えます。
transition_states()で、フレームの切り替えとバーの変化を行います。states引数(第1引数)にiteration列(試行回数)を指定します。
遷移(実際のデータの間を移動)するフレーム数(の比)(transition_length引数)と実際のデータで一時停止(同じグラフを表示)するフレーム数(の比)(state_length引数)を指定できます。それぞれのフレーム数をt, sとすると、1試行当たりのフレーム数はt+sになります。よって、全体(0回目からN回目まで)のフレーム数は(N+1)*(t+s)になります。
transition_states()については「transition_states関数【gganimate】 - からっぽのしょこ」を参照してください。
また、ease_aes()で、アニメーションの緩急を設定します。ease_aes()については「ease_aes関数【gganimate】 - からっぽのしょこ」を参照してください。
theme()のaxis.text.y引数にelement_blank()を指定して、x軸目盛を非表示にします。代わりに、geom_text()のlabel引数にv列を指定して、サイコロの面(カテゴリ名)を表示します。これにより、バーと連動して表示されます。
図の余白からカテゴリ名がはみ出る場合は、theme()のplot.margin引数で調整します。margin()のl引数(第4引数)が左側の余白のサイズです。
同様に、geom_text()で出現回数(y軸の値)を表示します。
animate()でgif画像を作成します。nframes引数に全体のフレーム数、fps引数に1秒当たりのフレーム数を指定します。(ただし、fpsが100くらいから?描画がバグったり設定した通りにならなかったりします?)
また、最終結果を確認できるように、end_pause引数に最後のグラフで一時停止するフレーム数を指定します。この値もnframes引数に含める必要があります。
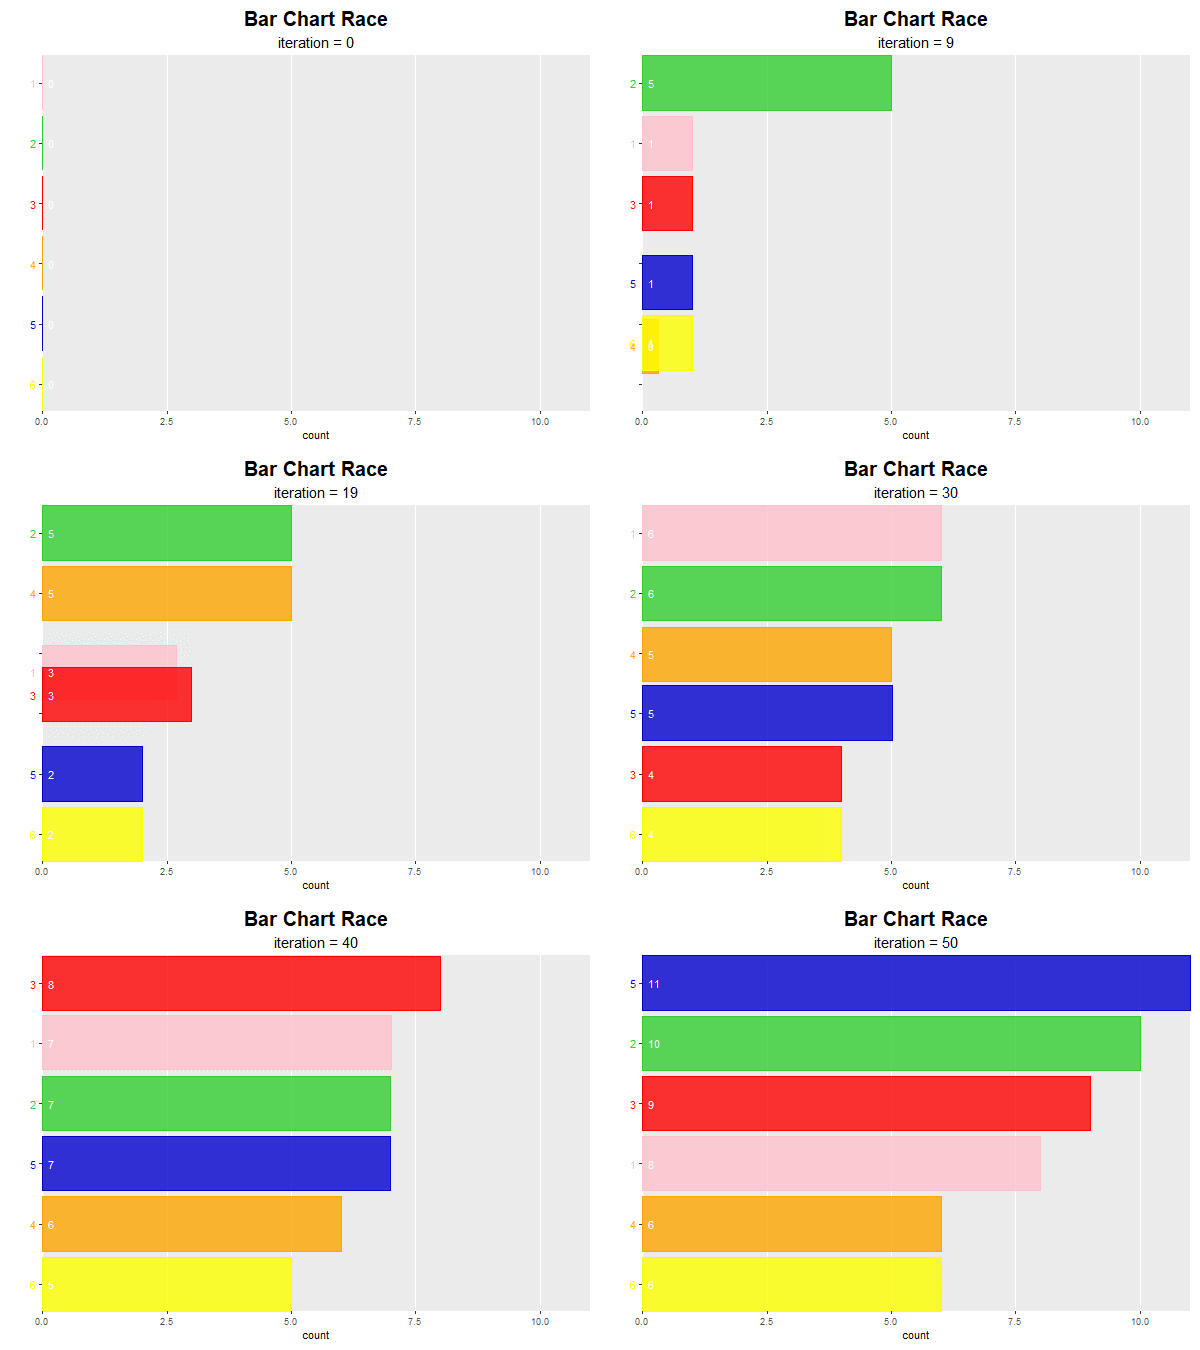
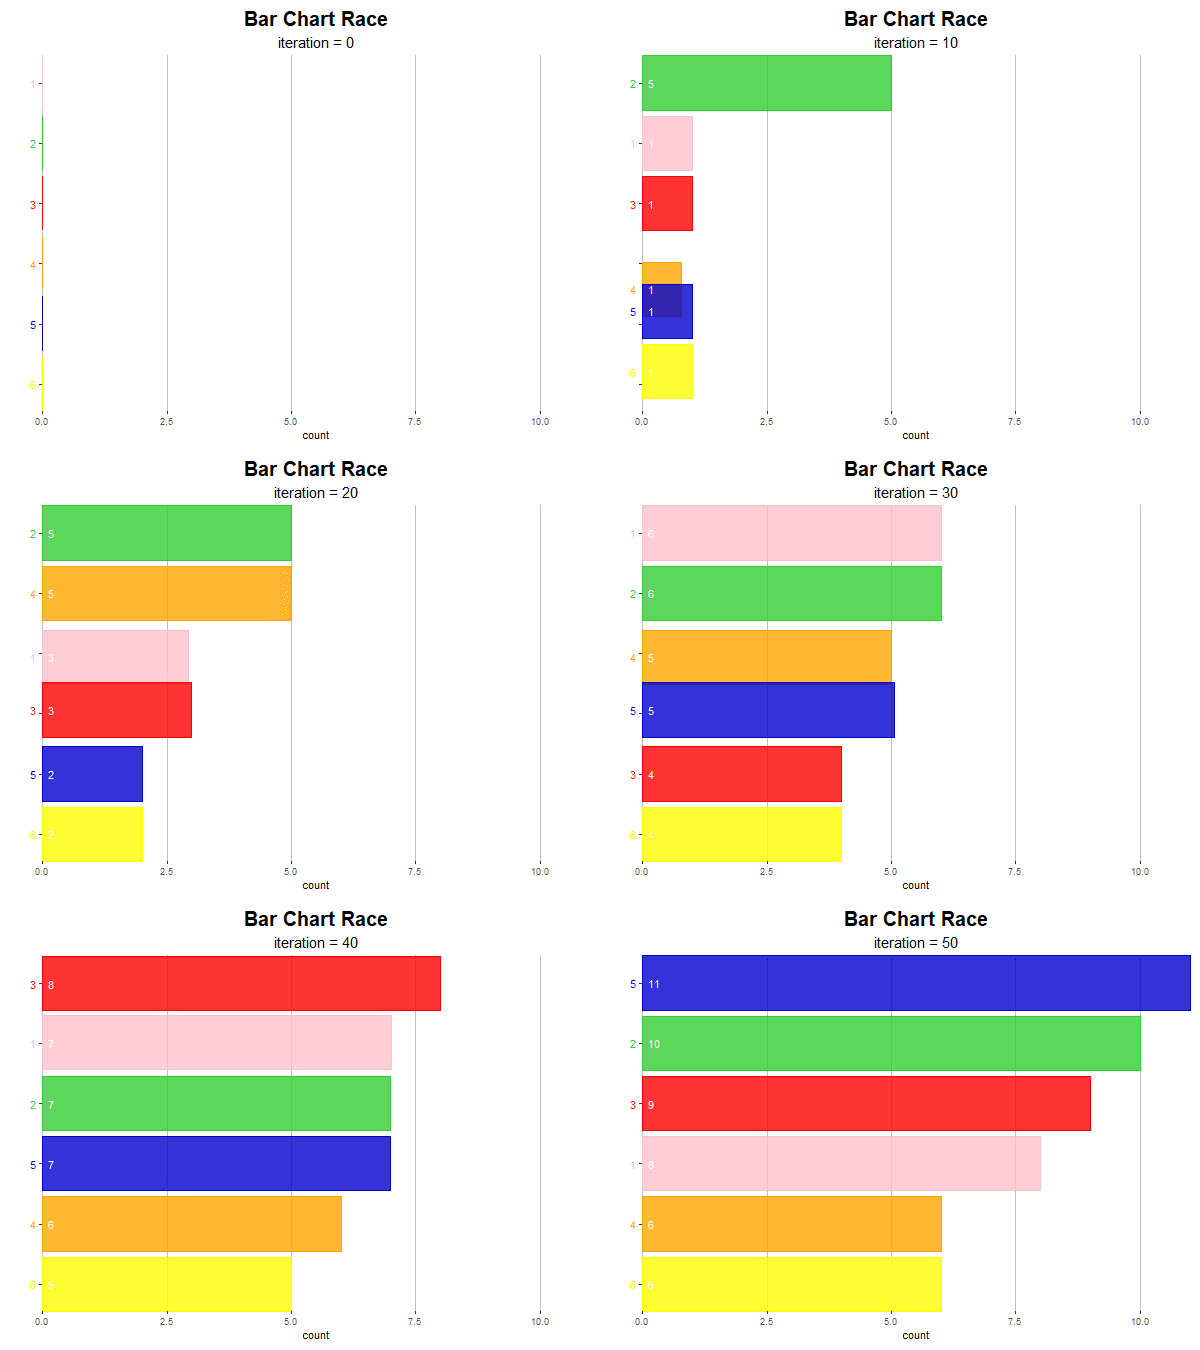
右の図は、theme()のコメントアウトを外した設定のグラフです。また、t <- 9, s <- 3にして、1秒間に2試行分のフレーム(fps = (t+s)*2)となるように設定しています。
2つ目は、出現回数に応じてフレーム(試行)ごとにy軸の表示範囲が変わります。
# 遷移フレーム数を指定
t <- 8

# 実データでの停止フレーム数を指定
s <- 4

# 最終結果での停止フレーム数を指定
e <- 50

# バーチャートレースを作成:(y軸可変)
anim <- ggplot(rank_df, aes(x = ranking, y = count, fill = v, color = v)) +
  geom_bar(stat = "identity", width = 0.9, alpha = 0.8) + # 出現回数のバー
  geom_text(aes(y = 0, label = paste(v, " ")), hjust = 1) + # カテゴリ名
  geom_text(aes(label = paste(" ", round(count))), hjust = 0) + # 出現回数
  gganimate::transition_states(states = iteration, transition_length = t, state_length = s, wrap = FALSE) + # フレーム
  gganimate::ease_aes("cubic-in-out") + # アニメーションの緩急
  scale_fill_manual(values = c("pink", "limegreen", "red", "orange", "mediumblue", "yellow")) + # バーの色:(不必要)
  scale_color_manual(values = c("pink", "limegreen", "red", "orange", "mediumblue", "yellow")) + # 枠線の色:(不必要)
  theme(
    axis.title.x = element_blank(), # 横軸のラベル
    axis.title.y = element_blank(), # 縦軸のラベル
    axis.text.x = element_blank(), # 横軸の目盛ラベル
    axis.text.y = element_blank(), # 縦軸の目盛ラベル
    axis.ticks.x = element_blank(), # 横軸の目盛指示線
    axis.ticks.y = element_blank(), # 縦軸の目盛指示線
    #panel.grid.major.x = element_line(color = "grey", size = 0.1), # 横軸の主目盛線
    panel.grid.major.y = element_blank(), # 縦軸の主目盛線
    panel.grid.minor.x = element_blank(), # 横軸の補助目盛線
    panel.grid.minor.y = element_blank(), # 縦軸の補助目盛線
    panel.border = element_blank(), # グラフ領域の枠線
    #panel.background = element_blank(), # グラフ領域の背景
    plot.title = element_text(color = "black", face = "bold", size = 20, hjust = 0.5), # 全体のタイトル
    plot.subtitle = element_text(color = "black", size = 15, hjust = 0.5), # 全体のサブタイトル
    plot.margin = margin(t = 10, r = 40, b = 10, l = 40, unit = "pt"), # 全体の余白
    legend.position = "none" # 凡例の表示位置
  ) + # 図の体裁
  coord_flip(clip = "off", expand = FALSE) + # 軸の入れ替え
  scale_x_reverse() + # x軸を反転
  gganimate::view_follow(fixed_x = TRUE) + # フレームごとに表示範囲を調整
  labs(title = "Bar Chart Race",
       subtitle = "iteration = {closest_state}") # ラベル

# gif画像を作成
gganimate::animate(
  plot = anim,
  nframes = (N+1)*(t+s)+e, end_pause = e, fps = (t+s)*3,
  width = 600, height = 450
)
view_follow()を使うと、x軸とy軸の表示範囲がフレームごとにデータに合わせて調整されます。ただし、view_follow()とcoord_flip()を組み合わせて使うと(?)目盛関連の表示がバグるので、表示しないように図の体裁を変更しています。view_follow()については「view_follow関数【gganimate】 - からっぽのしょこ」を参照してください。
図の余白からy軸の値(この例だと出現回数)がはみ出る場合は、margin()のr引数(第2引数)を調整します。
(作図時に警告メッセージが出ますがよく分かりません。)
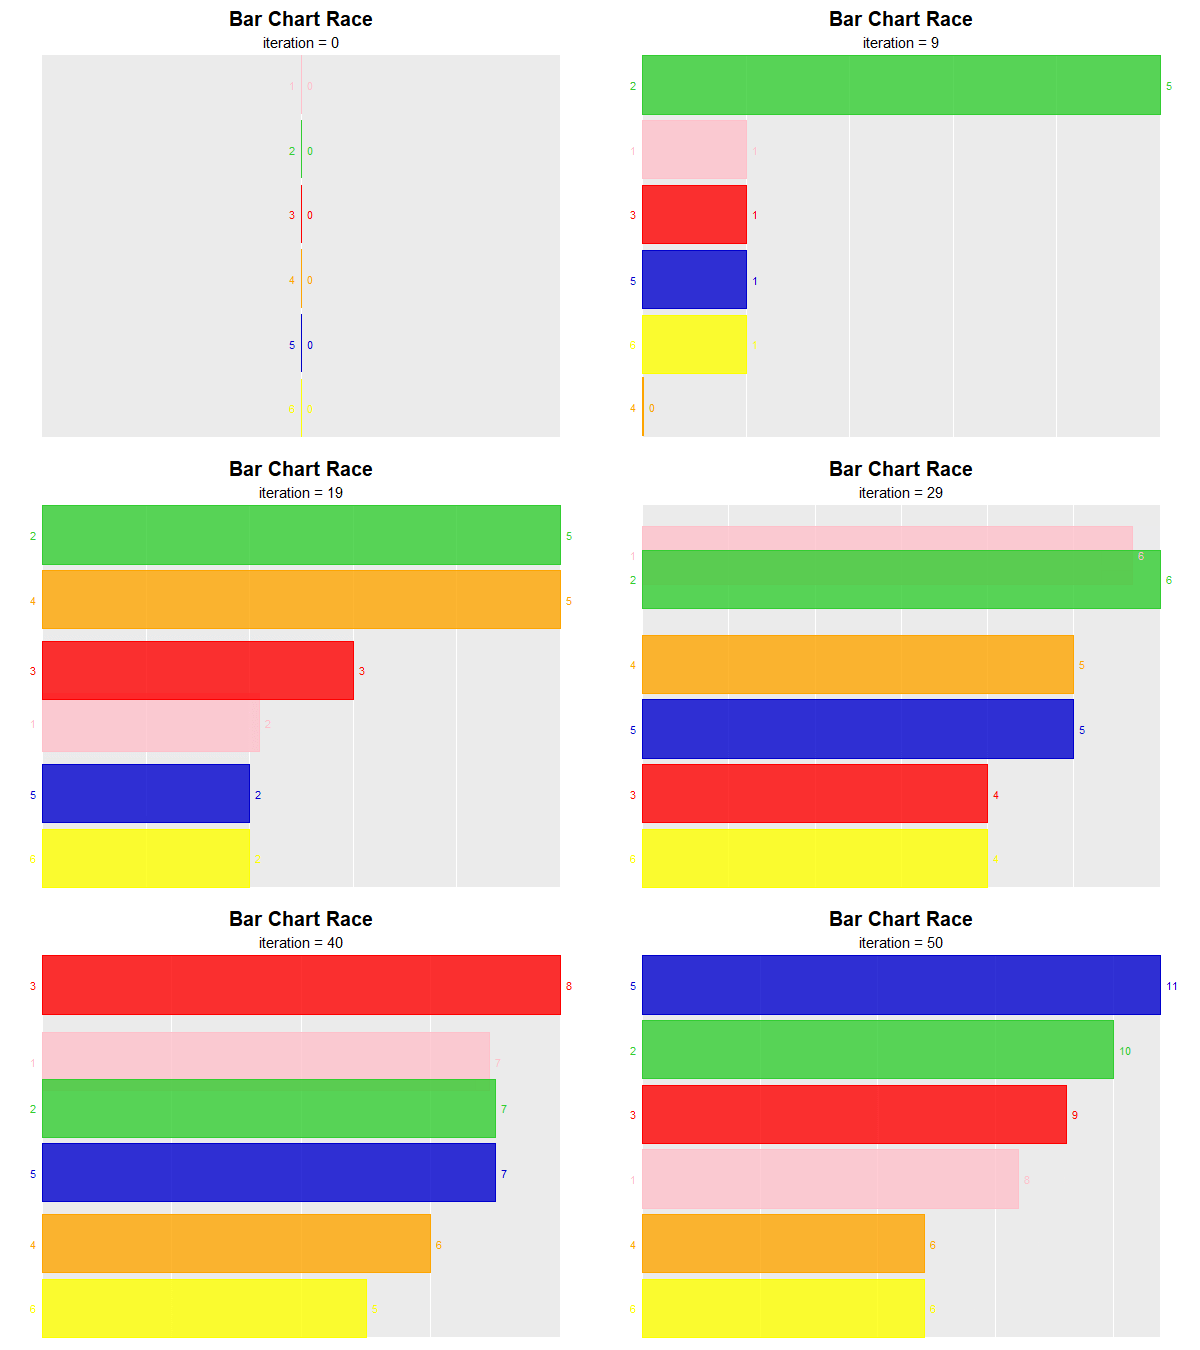
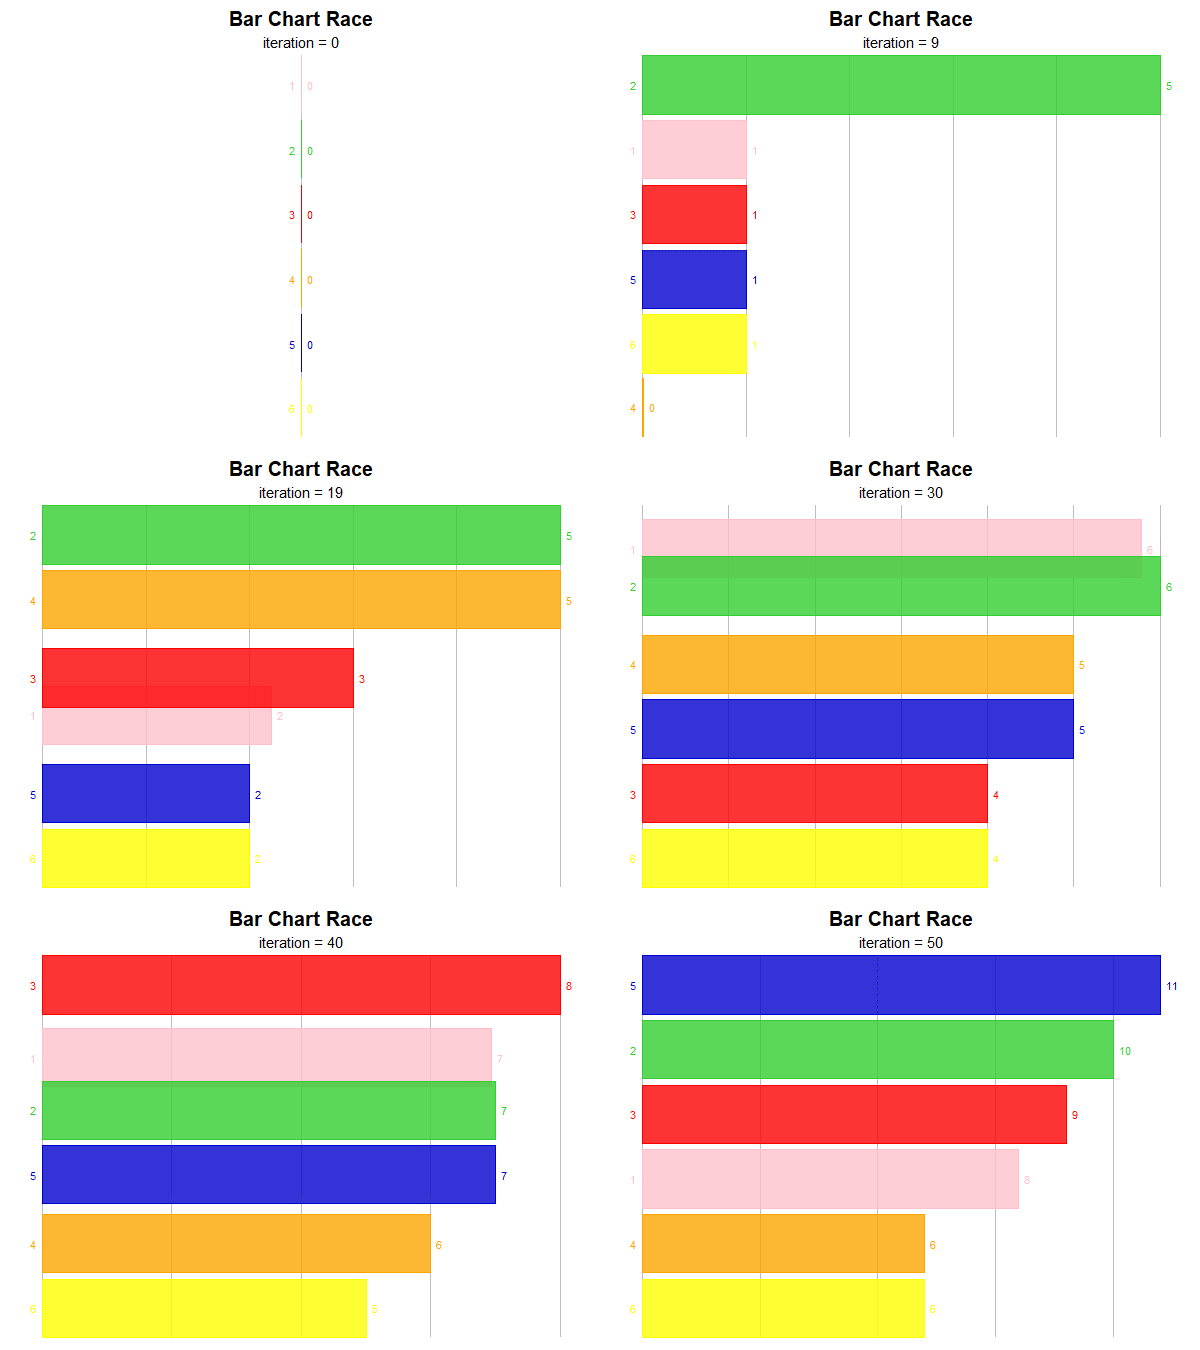
右の図は先ほどと同じ設定です。
続いて、棒グラフではなく折れ線グラフを使うラインチャートレースを作成します。
# 遷移フレーム数を指定
t <- 5

# 最終結果での停止フレーム数を指定
e <- 50

# ラインチャートレースを作成
anim <- ggplot(rank_df, aes(x = iteration, y = ranking, color = v)) +
  geom_line(size = 1, alpha = 0.5) + # 順位の推移
  geom_point(size = 5) + # 順位
  geom_segment(mapping = aes(xend = N, yend = ranking), linetype = "dashed") + # 指示線
  geom_text(mapping = aes(x = N, label = paste("  ", v)), hjust = 0, vjust = 0) + # カテゴリ名
  geom_text(mapping = aes(label = paste("  ", count)), hjust = 0, vjust = 1) + # 出現回数
  gganimate::transition_reveal(along = iteration) + # フレーム
  gganimate::ease_aes("cubic-in-out") + # アニメーションの緩急
  scale_y_reverse(breaks = 1:V) + # x軸を反転
  scale_color_manual(values = c("pink", "limegreen", "red", "orange", "mediumblue", "yellow")) + # 枠線の色:(不必要)
  theme(
    panel.grid.minor.y = element_blank(), # 縦軸の補助目盛線
    plot.title = element_text(color = "black", face = "bold", size = 20, hjust = 0.5), # 全体のタイトル
    plot.subtitle = element_text(color = "black", size = 15, hjust = 0.5), # 全体のサブタイトル
    legend.position = "none" # 凡例の表示位置
  ) + # 図の体裁
  xlim(c(0, N+5)) + # x軸の表示範囲
  labs(title = "Line Chart Race",
       subtitle ="iteration = {frame_along}") # ラベル

# gif画像を作成
gganimate::animate(
  plot = anim,
  nframes = (N+1)*t+e, end_pause = e, fps = t*5,
  width = 600, height = 450
)
先ほどは、バーの高さで出現回数を可視化しました。こちらは、折れ線グラフで順位の推移を可視化できます。
x軸の値にiteration列(試行回数)、y軸の値にranking列(出現回数の順位)、バーなどの色にv列(サイコロの面)を指定します。
transition_reveal()で、フレームの切り替えと折れ線の変化を行います。along引数(第1引数)にiteration列を指定します。
transition_reveal()については「transition_reveal.Rmd」を参照してください。
現在の順位とサイコロの面(カテゴリ名)の対応が分かりやすいように、geom_segment()で補助線を引きます。x, y引数のに指定した点(値)とxend, yend引数に指定した点(値)を直線で繋ぎます。
カテゴリ名がグラフ領域に収まらない場合は、xlim(c(最小値, 最大値))の最大値を調整します。
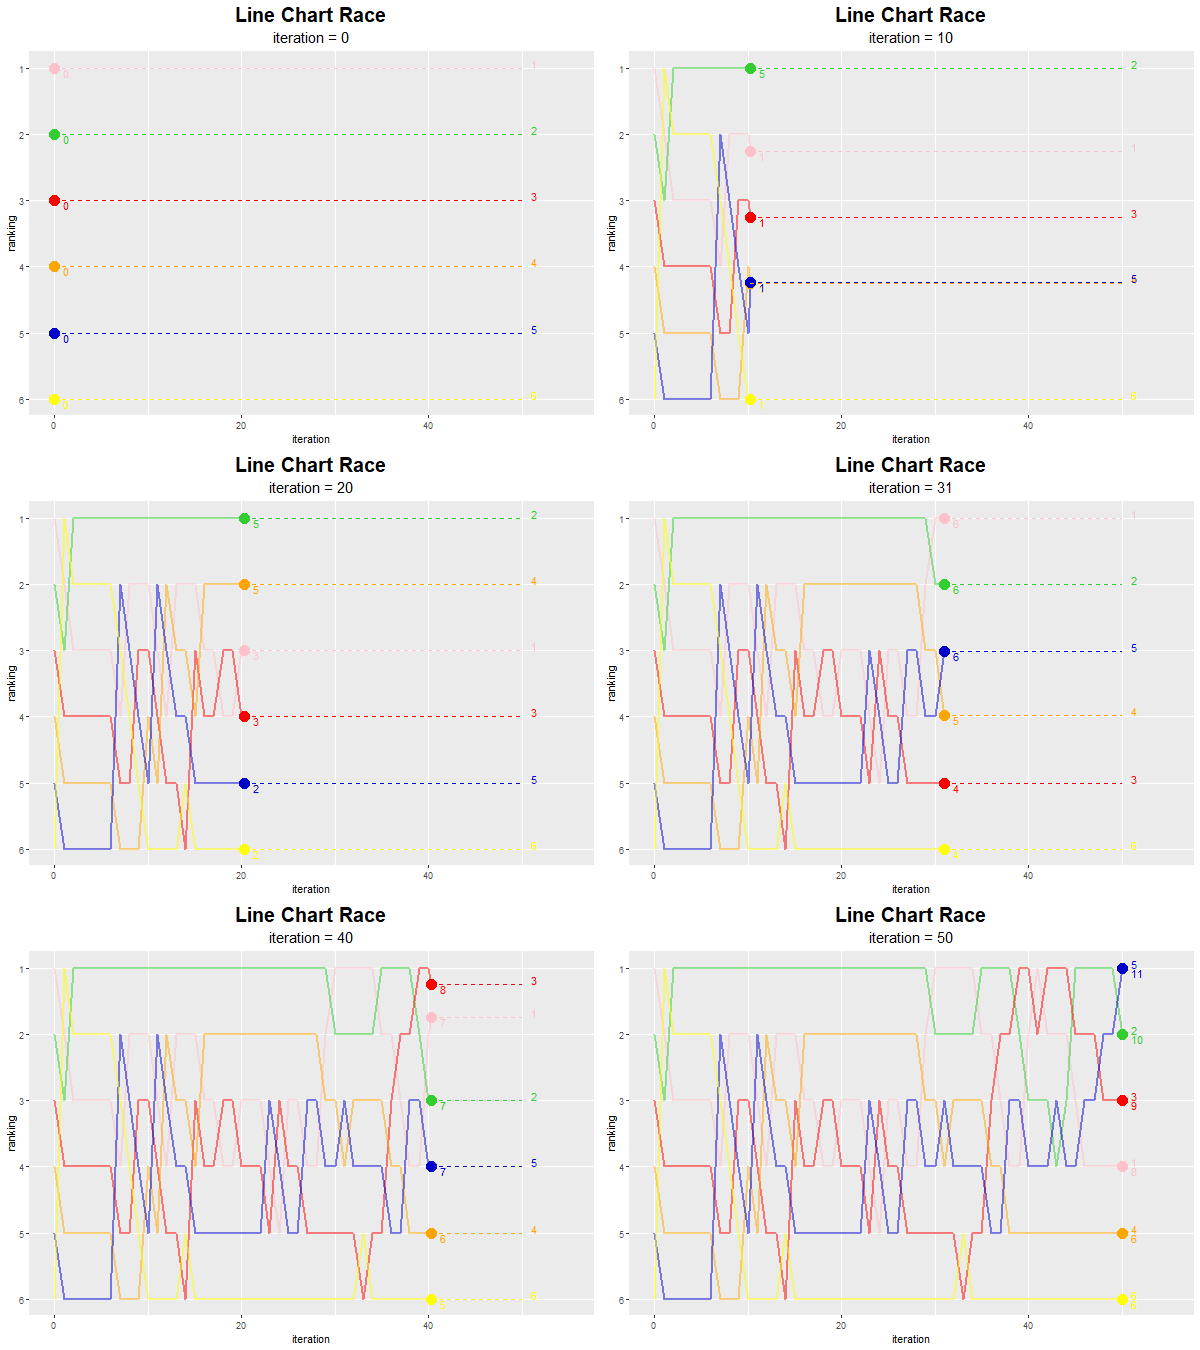
上のグラフは順位の推移を可視化しました。次は、出現回数の推移を可視化します。
# 遷移フレーム数を指定
t <- 5

# 最終結果での停止フレーム数を指定
e <- 50

# ラインチャートレースを作成
anim <- ggplot(rank_df, aes(x = iteration, y = count, color = v)) +
  geom_line(size = 1, alpha = 0.5) + # 出現回数の推移
  geom_point(size = 5, alpha = 0.5) + # 出現回数
  geom_segment(mapping = aes(xend = N, yend = count), linetype = "dashed") + # 指示線
  geom_text(mapping = aes(x = N, label = paste("  ", v)), hjust = 0, vjust = 0) + # カテゴリ名
  geom_text(mapping = aes(label = paste("  ", count)), hjust = 0, vjust = 1) + # 出現回数
  gganimate::transition_reveal(along = iteration) + # フレーム
  gganimate::ease_aes("cubic-in-out") + # アニメーションの緩急
  scale_color_manual(values = c("pink", "limegreen", "red", "orange", "mediumblue", "yellow")) + # 枠線の色:(不必要)
  theme(
    panel.grid.minor.y = element_blank(), # 縦軸の補助目盛線
    plot.title = element_text(color = "black", face = "bold", size = 20, hjust = 0.5), # 全体のタイトル
    plot.subtitle = element_text(color = "black", size = 15, hjust = 0.5), # 全体のサブタイトル
    legend.position = "none" # 凡例の表示位置
  ) + # 図の体裁
  xlim(c(0, N+5)) + # x軸の表示範囲
  labs(title = "Line Chart Race",
       subtitle ="iteration = {frame_along}") # ラベル

# gif画像を作成
gganimate::animate(
  plot = anim,
  nframes = (N+1)*t+e, end_pause = e, fps = t*5,
  width = 600, height = 450
)
y軸の値をcount列(出現回数)にします。
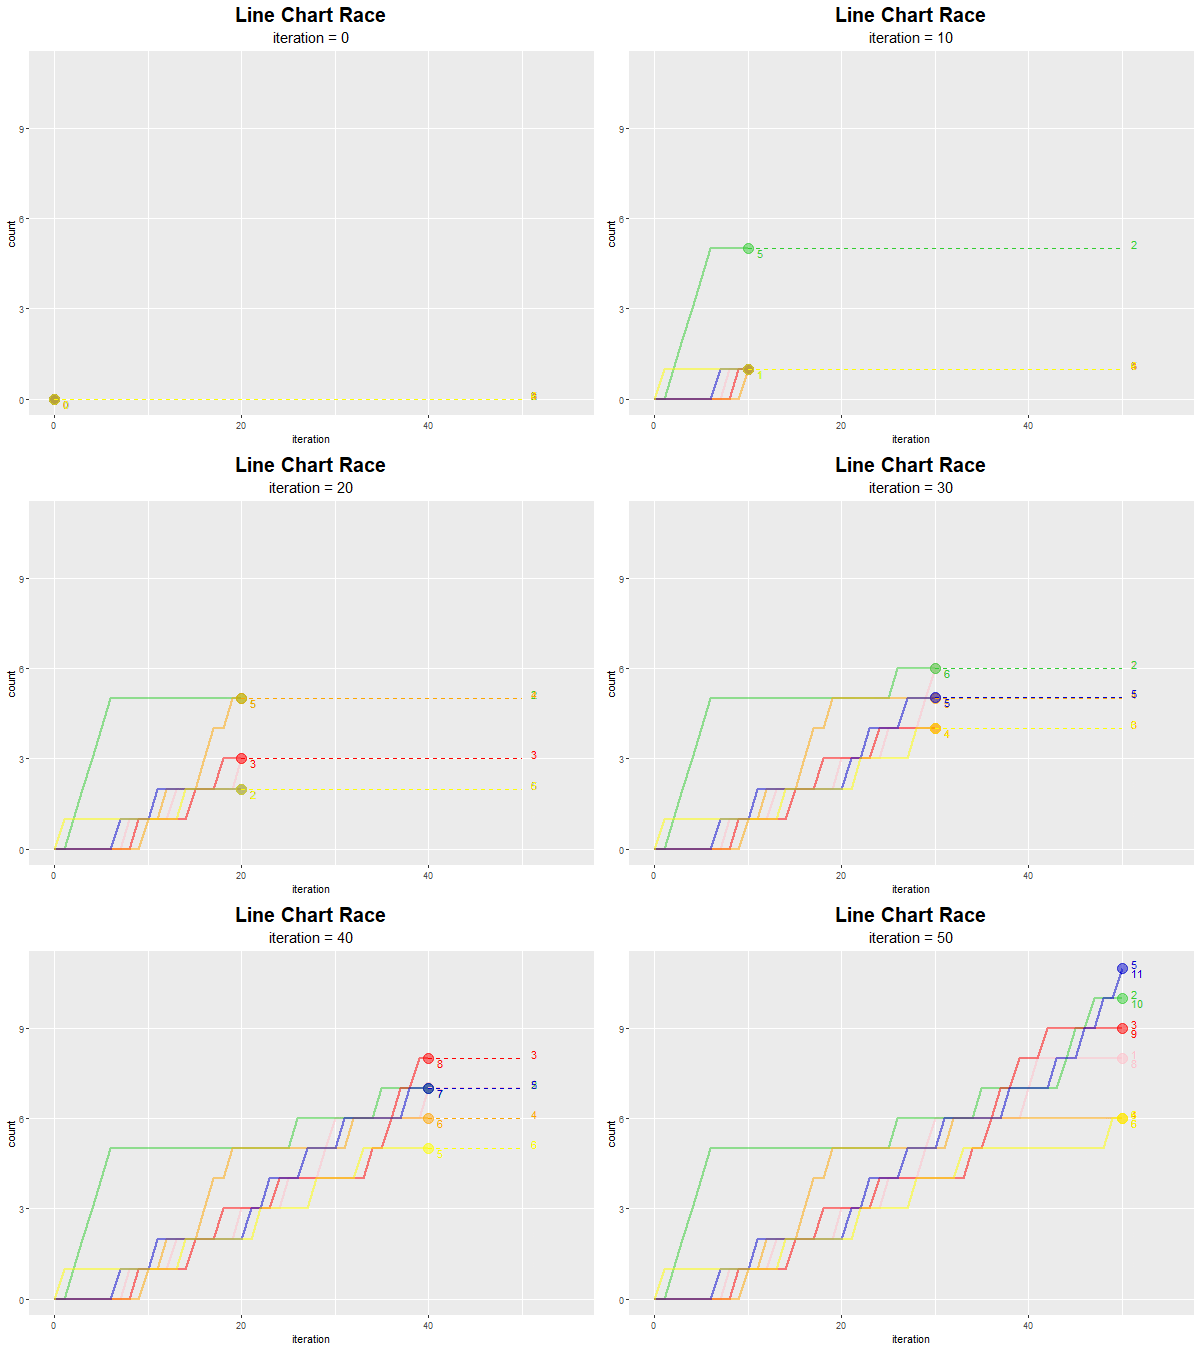
(これもラインチャートレースって呼んでいいのでしょうか?ただの動く折れ線グラフ?)
以上で、バーチャートレースとラインチャートレースを作成できました。
参考リンク
おわりに
ようやくやりたかったことができました。